
@AstonJ there are a couple of different “units of measure” you are talking about there:
MW (megawatts) - capacity or peak generation amount
MWh (megawatt-hour) - energy usage over time
That 16,000 MW value mentioned is the maximum capacity. This is the amount that could be produced if everything was “wide open” producing as much as possible at any one particular instant. Needless to say you can’t produce that amount 24x7 especially for distributed energy resources like solar. For example, a perfect solar production curve looks something like this:
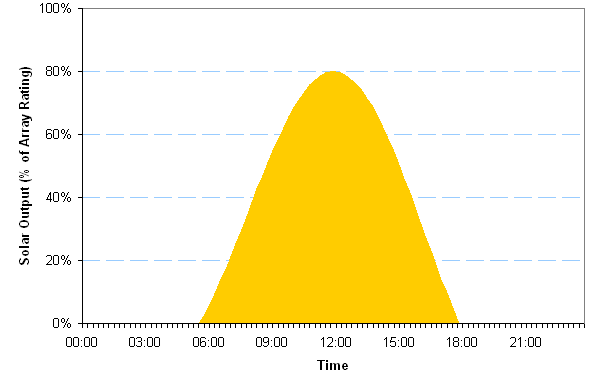
This graph that I copied from a Bing image search shows the producing peak around 80% of rated capacity for the solar panels (which is about right) but for our explanation, let’s assume that we get 16,000 MW at that 80% mark. Needless to say, we don’t get 16,000 MW all day long. At night time, there is nothing. Then you start seeing the production ramp up as the sun comes up early of a morning and then trails back off during the afternoon. If you take the average over the course of a day, it might be 4,000 MW during a 24 hour period on a perfect day. Now we are starting to get into energy usage! ![]()
If we take that average of 4,000 MW * 24h in a day we end up with 96,000 MWh (energy usage). Since we are normally billed at a kWh (kilowatt-hour) value, 96,000 MWh = 96,000,000 kWh of energy produced per day.
Now, we normally like to say that an “average” US home uses about 1,200 kWh/home each month. I’m not sure that this is really accurate (I know I use a lot more than that) but it is an easy number to work with here. To get that to a daily number let’s divide by 30:
1,200 kWh/30 days/home ~ 40 kWh/day/home <= average per home
Now, take the total energy generated per day / average usage per day:
96,000,000 kWh/day / 40kWh/day/home ~ 2.4mil homes
Now of course this assumes a perfect production day every day which as you know never happens with solar. But, as you start layering in other generation (wind, batter energy storage, hydro) that can pick up slack in lower solar production times, this can change the equation some. So basically, take my numbers above with a grain of salt…they are just an example with some round numbers. The real calculations to help balance supply and demand have to take a lot into consideration…and I don’t work in that department so I’m not an expert. ![]()
If you want to look into things a little more on solar production, research “duck curve solar” and see what you get. Basically, energy usage and solar production do NOT align with each other which causes problems for the balancing of power on the electric grid…but this is where things like energy storage can come into play to help balance things out again. There is a whole lot to unpack here. ![]()
Hopefully this helps a little.